計算密度
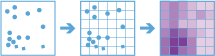
The Calculate Density tool creates a density map from point features by spreading known quantities of some phenomenon (represented as attributes of the points) across the map. The result is a layer of areas classified from least dense to most dense.
For point input, each point should represent the location of some event or incident, and the result layer represents a count of the incident per unit area. A higher density value in a new location means that there are more points near that location. In many cases, the result layer can be interpreted as a risk surface for future events. For example, if the input points represent locations of lightning strikes, the result layer can be interpreted as a risk surface for future lightning strikes.
Other use cases of this tool include the following:
- Creating crime-density maps to help police departments properly allocate resources to high crime areas.
- Calculating densities of hospitals within a county. The result layer will show areas with high and low accessibility to hospitals, and this information can be used to decide where new hospitals should be built.
- Identifying areas that are at high risk of forest fires based on historical locations of forest fires.
- Locating communities that are far from major highways in order to plan where new roads should be constructed.
選擇計算密度所使用的點圖層
The point layer on which the density will be calculated.
除了從地圖選擇圖層外,您也可以選擇下拉式清單底部的 瀏覽圖層,以瀏覽到大數據檔案分享資料集或圖徵圖層的內容。
選擇用來計算密度的一或多個欄位
Provide one or more fields specifying the number of incidents at each location. For example, if you have points that represent cities, you can use a field representing the population of the city as the count field, and the resulting population density layer will calculate larger population densities near cities with larger populations.
The density for the count of points will always be calculated. If no fields are selected, each location will be assumed to represent a single count.
選擇容器形狀
The shape of bins that points are aggregated into and used for the density calculation.
選擇用於計算密度的容器大小
The size of the bins generated. For a square bin, the size represents the height of the square. For hexagon, the size represents the height of the hexagon (from parallel sides).
選擇要套用的密度加權
The type of weighting applied to the density calculation. There are two options:
- Uniform—This calculates a magnitude per area.
- Kernel—Applies a kernel function to fit a smooth tapered surface to each point.
選擇鄰域大小
The size of the area used to calculate the density. The neighborhood size must be larger than the bin size.
選擇密度的輸出單位
The desired output units of the density values. By default, this is set to the units in your map (for example, square meters). If density values are very small, you can increase the size of the area units (for example, square meters to square kilometers) to return larger values. The values only scale the result.
使用時間片段計算密度(選用)
若是在輸入點圖層上啟用時間,且其為即時類型,則可使用時間片段進行分析。使用時間時可設定三個參數:
- 時間間隔
- 時間步長
- 參考時間
想像您有表示年時間的資料,且您想要使用每週片段進行分析。若要這麼做,您需要將 時間間隔設為 1 週。
想像您有表示年時間的資料,且您想要使用每月的第一週進行分析。若要這麼做,需要將 時間間隔設為 1 週、 時間步長設為 1 個月,以及將 參考時間設為 1 月 1 日上午 12:00。
用來計算密度的時間間隔
使用於分段資料的時間間隔。時間間隔可單獨使用,或搭配使用 時間步長或 參考時間參數。
若要建立時間片段,以便在每週一上午 9:00 到上午 10:00 發生, 時間間隔將是 1 小時、 時間步長將是 1 週,且 參考時間將是 週一上午 9:00:00。
用來計算密度的時間步長
用於計算時間片段的步長。 時間步長可單獨使用,或搭配使用 時間間隔、 參考時間,或 時間間隔和 參考時間二者。
若要建立時間片段,以便在每週一上午 9:00 到上午 10:00 發生, 時間間隔將是 1 小時、 時間步長將是 1 週,且 參考時間將是 週一上午 9:00:00。
用來對齊時間分段的參考時間
用來對齊時間分段的日期和時間。 時間步長將從參考的時間起算並繼續向後流動。
若要建立時間片段,以便在每週一上午 9:00 到上午 10:00 發生, 時間間隔將是 1 小時、 時間步長將是 1 週,且 參考時間將是 週一上午 9:00:00。
空間參考 (wkid)
這是搶鮮版的暫時參數,用於設定處理空間參考。許多大數據工具要求將投影的座標系統作為空間參考,以進行處理。預設情況下,工具將使用輸入座標系統,但若是地理座標系統則將失敗。若要設定投影的座標系統,請輸入 WKID。例如, Web Mercator 將輸入 3857。
選擇資料儲存庫
這是搶鮮版的暫時參數,用於設定儲存結果的資料儲存庫。兩個資料儲存庫皆屬於 ArcGIS Data Store。如果選擇時空資料儲存庫但尚未安裝,工具將失敗。
結果圖層名稱
在 我的內容中建立並新增到地圖中的圖層的名稱。預設名稱參照工具名稱以及輸入圖層名稱。如果圖層已存在,工具將失敗。
使用 將結果儲存到下拉式方塊,可以在 我的內容中指定储存结果的文件夾的名稱。